> ## Documentation Index
> Fetch the complete documentation index at: https://docs.apitally.io/llms.txt
> Use this file to discover all available pages before exploring further.
# Apps overview
> View key API metrics for all your apps at a glance.
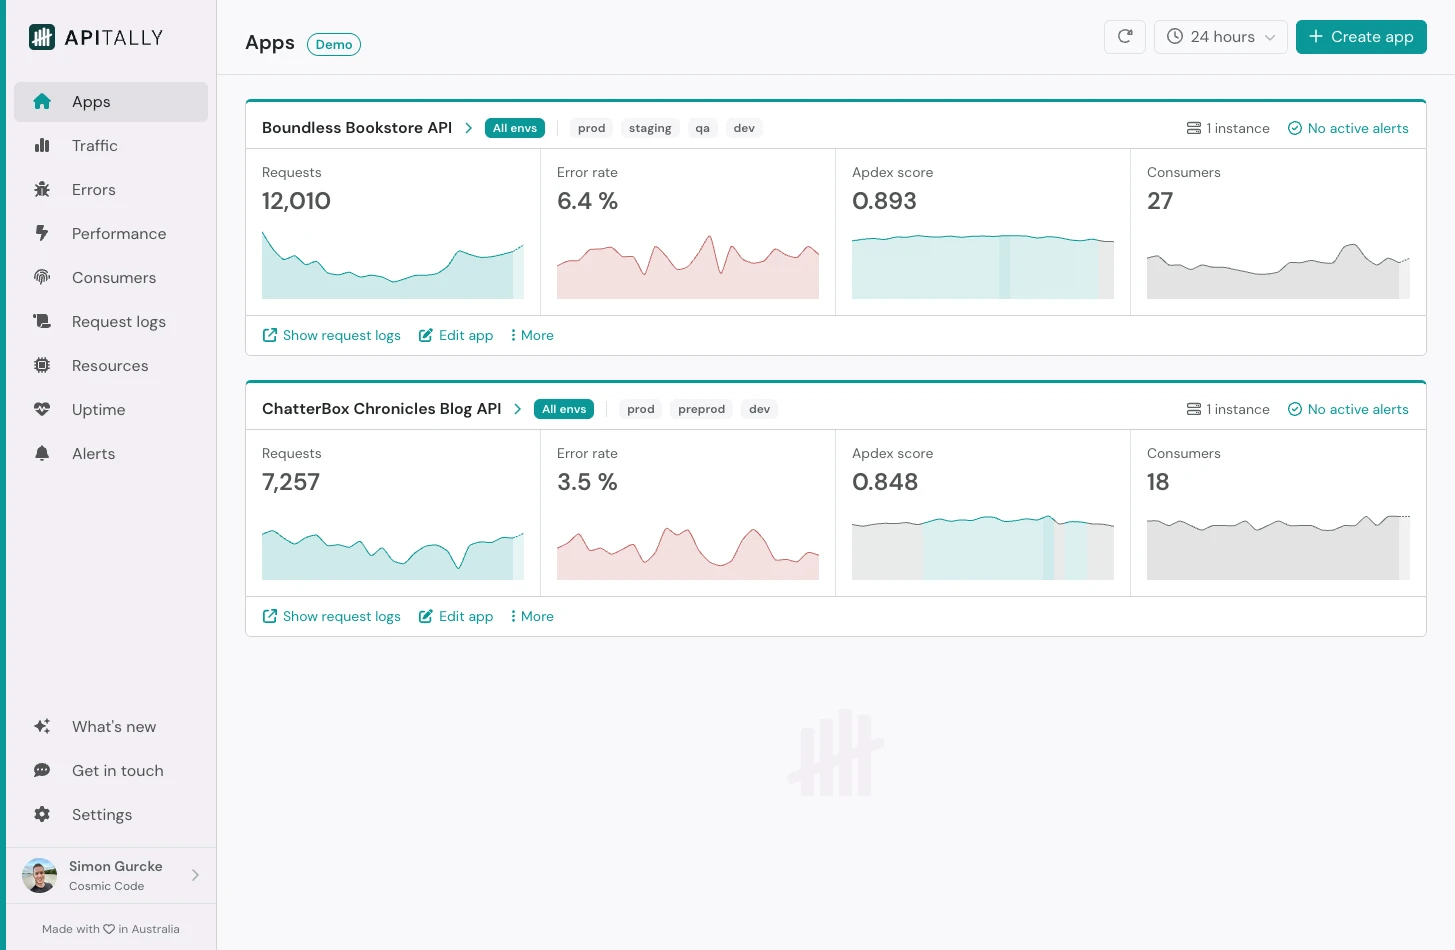 When you open the Apitally dashboard, you first land on the *Apps* page.
Here you see an overview of key API metrics for all your applications, including sparkline graphs that help you quickly identify unexpected spikes or drops.
Clicking on a metric or graph takes you to the relevant dashboard with more details:
Traffic dashboard
Errors dashboard
Performance dashboard
Consumers dashboard
When you open the Apitally dashboard, you first land on the *Apps* page.
Here you see an overview of key API metrics for all your applications, including sparkline graphs that help you quickly identify unexpected spikes or drops.
Clicking on a metric or graph takes you to the relevant dashboard with more details:
Traffic dashboard
Errors dashboard
Performance dashboard
Consumers dashboard