> ## Documentation Index
> Fetch the complete documentation index at: https://docs.apitally.io/llms.txt
> Use this file to discover all available pages before exploring further.
# Setup guide for ASP.NET Core
> Just a few simple steps to get started with Apitally.
export const language_0 = "csharp"
export const framework_0 = "ASP.NET Core"
This page guides you through the steps of configuring your [ASP.NET Core](https://dotnet.microsoft.com/en-us/apps/aspnet) application to work with Apitally. If you don't have an account yet, now would be a good time to [sign up](https://app.apitally.io/?signup).
Once you're done with this guide, you will be able to:
* Get detailed metrics on API usage, errors, and performance
* Track API adoption and usage by individual consumers
* Log individual API requests, responses, and correlated application logs
* See what's causing slow API requests with traces
* Monitor uptime and set up custom alerts
## Create app
To get started, create a new app in the [Apitally dashboard](https://app.apitally.io/apps) and select {framework_0} as your framework.
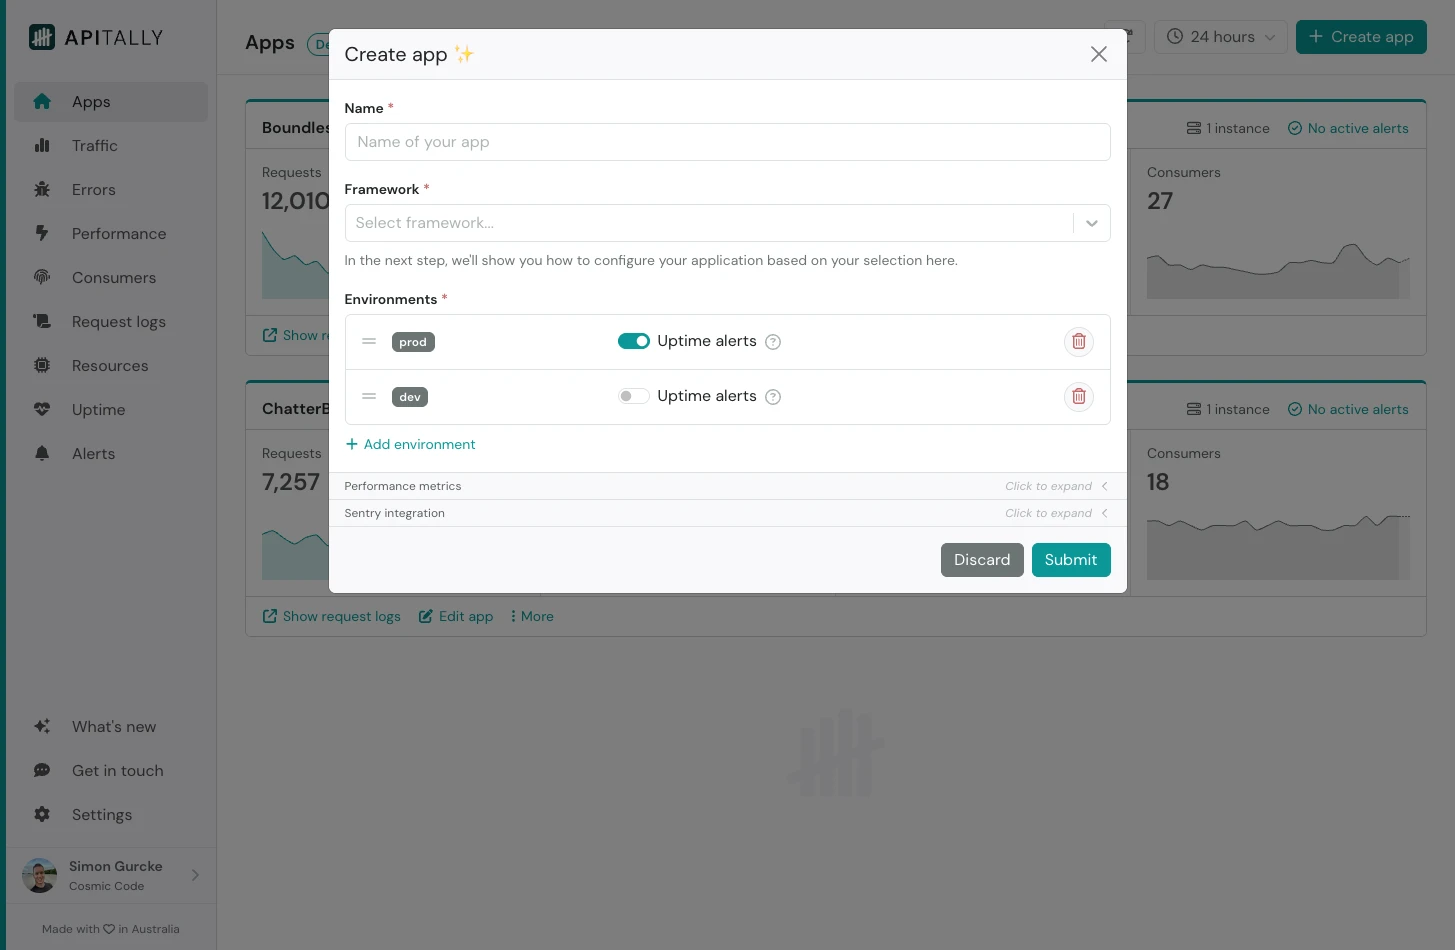 You can also configure the environments (e.g. `prod` and `dev`) for your app, or simply accept the defaults.
After submitting, you will see tailored setup instructions for your app. These include code snippets you can copy and paste into your project.
The **client ID** provided in the setup instructions uniquely identifies your app for the purpose of data ingestion only. It does not grant any kind of read access to your data.
## Add middleware
Next, install the [Apitally SDK](/sdk-reference/dotnet/overview) in your project:
```shell theme={null}
dotnet add package Apitally
```
Register the required services and middleware for Apitally in your `Program.cs` file and provide the `ClientId` for your app.
You'll find the `ClientId` on the *Setup instructions* page for your app in the Apitally dashboard, which is displayed immediately after creating the app.
You can also configure Apitally in your `appsettings.json` file, if you prefer.
```csharp Program.cs theme={null}
using Apitally;
var builder = WebApplication.CreateBuilder(args);
builder.Services.AddApitally(options =>
{
options.ClientId = "your-client-id";
options.Env = "dev"; // or "prod" etc.
});
var app = builder.Build();
app.UseApitally();
// ... rest of your middleware configuration
```
```json appsettings.json theme={null}
{
"Apitally": {
"ClientId": "your-client-id",
"Env": "dev"
}
}
```
Add the Apitally middleware before any other middleware to ensure it wraps the entire stack.
Deploy your application with these changes, or restart if you're testing locally.
At this point the basic setup for your application is complete and you will start seeing data in the Apitally dashboard.
## Identify consumers
To analyze and filter API traffic by consumers, you can associate requests with consumer identifiers in your application.
In most cases, use the authenticated identity to identify the consumer.
The identifier should be a string, such as a username, email address, or any other unique identifier.
Optionally, you can also provide a display name and group for each consumer.
To associate requests with consumers, set the `ApitallyConsumer` item in the request context. You can do this in middleware, for example:
```csharp Identifier only theme={null}
app.Use(async (context, next) =>
{
if (context.User.Identity.IsAuthenticated)
{
context.Items["ApitallyConsumer"] = context.User.Identity.Name;
}
await next();
});
```
```csharp With name and group theme={null}
using Apitally;
using System.Security.Claims;
app.Use(async (context, next) =>
{
if (context.User.Identity.IsAuthenticated)
{
context.Items["ApitallyConsumer"] = new ApitallyConsumer
{
Identifier = context.User.Identity.Name,
Name = context.User.FindFirst(ClaimTypes.Name)?.Value,
Group = context.User.FindFirst(ClaimTypes.Role)?.Value,
};
}
await next();
});
```
The *Consumers* dashboard now shows all consumers that have made requests to your application. You can also filter other dashboards by consumer.
## Configure request logging
Logging of individual requests and responses is disabled by default to protect potentially sensitive data.
If you enable it, you can configure in detail what parts of the request and response should be logged.
You can also mask sensitive information (e.g. in headers) and exclude certain requests from logging.
The SDK applies [default masking rules](/data-privacy#data-masking) for common sensitive headers, query parameters and request/response body fields.
{language_0 == "python" &&
You can also configure the environments (e.g. `prod` and `dev`) for your app, or simply accept the defaults.
After submitting, you will see tailored setup instructions for your app. These include code snippets you can copy and paste into your project.
The **client ID** provided in the setup instructions uniquely identifies your app for the purpose of data ingestion only. It does not grant any kind of read access to your data.
## Add middleware
Next, install the [Apitally SDK](/sdk-reference/dotnet/overview) in your project:
```shell theme={null}
dotnet add package Apitally
```
Register the required services and middleware for Apitally in your `Program.cs` file and provide the `ClientId` for your app.
You'll find the `ClientId` on the *Setup instructions* page for your app in the Apitally dashboard, which is displayed immediately after creating the app.
You can also configure Apitally in your `appsettings.json` file, if you prefer.
```csharp Program.cs theme={null}
using Apitally;
var builder = WebApplication.CreateBuilder(args);
builder.Services.AddApitally(options =>
{
options.ClientId = "your-client-id";
options.Env = "dev"; // or "prod" etc.
});
var app = builder.Build();
app.UseApitally();
// ... rest of your middleware configuration
```
```json appsettings.json theme={null}
{
"Apitally": {
"ClientId": "your-client-id",
"Env": "dev"
}
}
```
Add the Apitally middleware before any other middleware to ensure it wraps the entire stack.
Deploy your application with these changes, or restart if you're testing locally.
At this point the basic setup for your application is complete and you will start seeing data in the Apitally dashboard.
## Identify consumers
To analyze and filter API traffic by consumers, you can associate requests with consumer identifiers in your application.
In most cases, use the authenticated identity to identify the consumer.
The identifier should be a string, such as a username, email address, or any other unique identifier.
Optionally, you can also provide a display name and group for each consumer.
To associate requests with consumers, set the `ApitallyConsumer` item in the request context. You can do this in middleware, for example:
```csharp Identifier only theme={null}
app.Use(async (context, next) =>
{
if (context.User.Identity.IsAuthenticated)
{
context.Items["ApitallyConsumer"] = context.User.Identity.Name;
}
await next();
});
```
```csharp With name and group theme={null}
using Apitally;
using System.Security.Claims;
app.Use(async (context, next) =>
{
if (context.User.Identity.IsAuthenticated)
{
context.Items["ApitallyConsumer"] = new ApitallyConsumer
{
Identifier = context.User.Identity.Name,
Name = context.User.FindFirst(ClaimTypes.Name)?.Value,
Group = context.User.FindFirst(ClaimTypes.Role)?.Value,
};
}
await next();
});
```
The *Consumers* dashboard now shows all consumers that have made requests to your application. You can also filter other dashboards by consumer.
## Configure request logging
Logging of individual requests and responses is disabled by default to protect potentially sensitive data.
If you enable it, you can configure in detail what parts of the request and response should be logged.
You can also mask sensitive information (e.g. in headers) and exclude certain requests from logging.
The SDK applies [default masking rules](/data-privacy#data-masking) for common sensitive headers, query parameters and request/response body fields.
{language_0 == "python" && Check out the SDK reference to learn more about the request logging configuration options.
}
{language_0 == "javascript" && Check out the SDK reference to learn more about the request logging configuration options.
}
{language_0 == "go" && Check out the SDK reference to learn more about the request logging configuration options.
}
Check out the SDK reference to learn more about the request logging configuration options.
```json Basic example theme={null}
{
"Apitally": {
"ClientId": "your-client-id",
"Env": "dev",
"RequestLogging": {
"Enabled": true,
"IncludeRequestHeaders": true,
"IncludeRequestBody": true,
"IncludeResponseBody": true,
"CaptureLogs": true,
"CaptureTraces": false // requires instrumentation
}
}
}
```
```json Advanced example theme={null}
{
"Apitally": {
"ClientId": "your-client-id",
"Env": "dev",
"RequestLogging": {
"Enabled": true,
"IncludeQueryParams": true,
"IncludeRequestHeaders": true,
"IncludeRequestBody": true,
"IncludeResponseHeaders": true,
"IncludeResponseBody": true,
"IncludeException": true,
"CaptureLogs": true,
"CaptureTraces": false // requires instrumentation,
// Mask query parameters using regex
"QueryParamMaskPatterns": [
"^card_number$"
],
// Mask headers using regex
"HeaderMaskPatterns": [
"^X-Sensitive-Header$"
],
// Mask request/response body fields using regex
"BodyFieldMaskPatterns": [
"^sensitive_field$"
],
// Exclude paths from request logging using regex (common health check paths are excluded by default)
"PathExcludePatterns": [
"/metrics$"
]
}
}
}
```
```csharp Callbacks example theme={null}
builder.Services.PostConfigure(options =>
{
// Mask request/response body with custom logic via callbacks (e.g. for admin endpoints)
// The callback should return null to mask the whole body, or return the (modified) raw body
options.RequestLogging.MaskRequestBody = request =>
request.Path.StartsWith("/admin/") ? null : request.Body;
options.RequestLogging.MaskResponseBody = (request, response) =>
request.Path.StartsWith("/admin/") ? null : response.Body;
// Exclude requests from logging with custom logic via callback (e.g. exclude requests from a specific consumer)
// The callback should return true to exclude the request
options.RequestLogging.ShouldExclude = (request, response) =>
request.Consumer == "some-consumer";
});
```
The *Request logs* dashboard now shows individual requests handled by your application. You can filter, search, and inspect them in detail.
## Enable tracing
Tracing gives you a detailed breakdown of time spent during the handling of each request, showing the duration of database queries, HTTP calls, and other operations.
To enable tracing, set `CaptureTraces` to `true` and instrument the libraries you want to trace with OpenTelemetry. See the [tracing guide](/sdk-reference/dotnet/tracing) for further instructions.