> ## Documentation Index
> Fetch the complete documentation index at: https://docs.apitally.io/llms.txt
> Use this file to discover all available pages before exploring further.
# Setup guide for FastAPI on Cloudflare Workers
> Just a few simple steps to get started with Apitally.
export const framework_0 = "FastAPI (Cloudflare Workers)"
This page guides you through the steps of configuring your [FastAPI](https://fastapi.tiangolo.com) application running on [Cloudflare Workers](https://developers.cloudflare.com/workers/languages/python/) to work with Apitally.
If you don't have an account yet, now would be a good time to [sign up](https://app.apitally.io/?signup).
Once you're done with this guide, you will be able to:
* Get detailed metrics on API usage, errors, and performance
* Track API adoption and usage by individual consumers
* Log individual API requests, responses, and correlated application logs
* See what's causing slow API requests with traces
* Monitor uptime and set up custom alerts
## Create app
To get started, create a new app in the [Apitally dashboard](https://app.apitally.io/apps) and select {framework_0} as your framework.
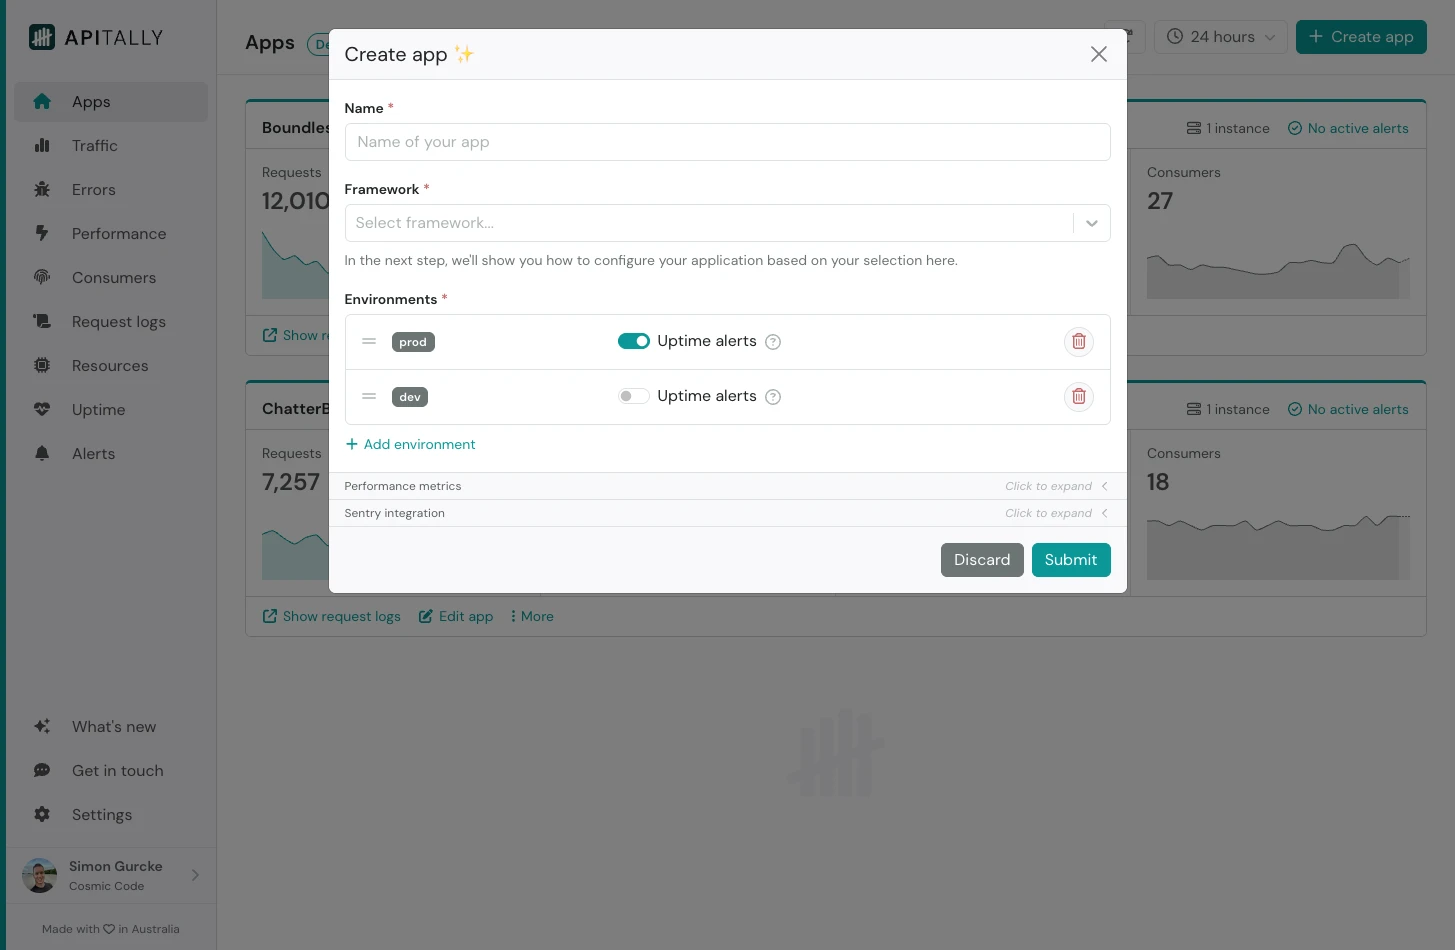 You can also configure the environments (e.g. `prod` and `dev`) for your app, or simply accept the defaults.
After submitting, you will see tailored setup instructions for your app. These include code snippets you can copy and paste into your project.
The **client ID** provided in the setup instructions uniquely identifies your app for the purpose of data ingestion only. It does not grant any kind of read access to your data.
## Create Logpush job
Log in to the [Cloudflare dashboard](https://dash.cloudflare.com/) and navigate to *Analytics & Logs > Logpush*. Create a [Logpush](https://developers.cloudflare.com/workers/observability/logs/logpush/) job with the following settings:
| Setting | Value |
| ---------------------------- | ------------------------------------------------------------------------------------------------ |
| Destination | HTTP destination |
| HTTP endpoint | `https://hub.apitally.io/v2/{client-id}/{env}/logpush` |
| Dataset | Workers trace events |
| If logs match... | Filtered logs:
You can also configure the environments (e.g. `prod` and `dev`) for your app, or simply accept the defaults.
After submitting, you will see tailored setup instructions for your app. These include code snippets you can copy and paste into your project.
The **client ID** provided in the setup instructions uniquely identifies your app for the purpose of data ingestion only. It does not grant any kind of read access to your data.
## Create Logpush job
Log in to the [Cloudflare dashboard](https://dash.cloudflare.com/) and navigate to *Analytics & Logs > Logpush*. Create a [Logpush](https://developers.cloudflare.com/workers/observability/logs/logpush/) job with the following settings:
| Setting | Value |
| ---------------------------- | ------------------------------------------------------------------------------------------------ |
| Destination | HTTP destination |
| HTTP endpoint | `https://hub.apitally.io/v2/{client-id}/{env}/logpush` |
| Dataset | Workers trace events |
| If logs match... | Filtered logs:
EventType equals `fetch` and
ScriptName equals `{your-worker-name}` |
| Send the following fields... | General:
Event, EventTimestampMs, Logs |
In the HTTP endpoint, replace `{client-id}` with your app's client ID and `{env}` with the environment (e.g. `prod` or `dev`). In the filter criteria, replace `{your-worker-name}` with the name of your Worker, as specified in your Wrangler config.
## Add middleware
Next, install the [Apitally Serverless SDK](/sdk-reference/python-serverless/overview) in your project.
```shell theme={null}
uv add apitally-serverless
```
Add the Apitally middleware to your FastAPI application.
```python theme={null}
from fastapi import FastAPI
from apitally_serverless.fastapi import ApitallyMiddleware
app = FastAPI()
app.add_middleware(ApitallyMiddleware)
```
If you're also using other middlewares, add the `ApitallyMiddleware` last, so
that it wraps the existing stack of middlewares.
## Configure Worker
Enable [Workers Logs](https://developers.cloudflare.com/workers/observability/logs/workers-logs/) and [Logpush](https://developers.cloudflare.com/workers/observability/logs/logpush/) in your Wrangler configuration file.
```toml wrangler.toml theme={null}
logpush = true
[observability]
enabled = true
head_sampling_rate = 1
[observability.logs]
invocation_logs = true
```
```json wrangler.json theme={null}
{
"logpush": true,
"observability": {
"enabled": true,
"head_sampling_rate": 1,
"logs": {
"invocation_logs": true
}
}
}
```
Then, deploy your application to Cloudflare Workers.
```shell theme={null}
uv run pywrangler deploy
```
At this point the basic setup for your application is complete and you will start seeing data in the Apitally dashboard after the first request is handled.
It can take 2-3 minutes for requests to show up in Apitally due to how Cloudflare Logpush batches log data before sending it.
Also note that Cloudflare Logpush doesn't include requests from local development environments, so you won't see them in the Apitally dashboard.
## Identify consumers
To analyze and filter API traffic by consumers, you can associate requests with consumer identifiers in your application.
In most cases, use the authenticated identity to identify the consumer.
The identifier should be a string, such as a username, email address, or any other unique identifier.
Optionally, you can also provide a display name and group for each consumer.
Use the `set_consumer` function to associate requests with consumers, for example in a dependency, middleware or directly in your endpoint functions.
```python Dependency theme={null}
from typing import Annotated
from fastapi import FastAPI, Depends, Request
from apitally_serverless.fastapi import set_consumer
def identify_consumer(request: Request, current_user: Annotated[User, Depends(get_current_user)]) -> None:
set_consumer(
request,
identifier=current_user.user_id,
name=current_user.name, # optional
group=current_user.group, # optional
)
app = FastAPI(dependencies=[Depends(identify_consumer)])
```
```python Endpoint function theme={null}
from typing import Annotated
from fastapi import FastAPI, Depends, Request
from apitally_serverless.fastapi import set_consumer
app = FastAPI()
@app.get("/items")
async def list_items(request: Request, current_user: Annotated[User, Depends(get_current_user)]) -> list[str]:
set_consumer(
request,
identifier=current_user.user_id,
name=current_user.name, # optional
group=current_user.group, # optional
)
return ["item1"]
```
The *Consumers* dashboard now shows all consumers that have made requests to your application. You can also filter other dashboards by consumer.
## Configure request logging
With the serverless SDK, request logging is enabled by default, however request headers and request/response bodies are not included unless explicitly enabled.
The SDK automatically applies [default masking rules](/data-privacy#data-masking) for common sensitive headers and request/response body fields. You can configure additional masking rules and exclude certain requests from logging.
```python Basic example theme={null}
from fastapi import FastAPI
from apitally_serverless.fastapi import ApitallyMiddleware
app = FastAPI()
app.add_middleware(
ApitallyMiddleware,
log_request_headers=True,
log_request_body=True,
log_response_body=True,
)
```
```python Advanced example theme={null}
from fastapi import FastAPI
from apitally_serverless.fastapi import ApitallyMiddleware
app = FastAPI()
app.add_middleware(
ApitallyMiddleware,
log_request_headers=True,
log_request_body=True,
log_response_headers=True,
log_response_body=True,
# Mask headers using regex
mask_headers=[r"^X-Sensitive-Header$"],
# Mask request/response body fields using regex
mask_body_fields=[r"^sensitive_field$"],
# Exclude paths from request logging using regex
exclude_paths=[r"/health$", r"/metrics$"],
)
```
The *Request logs* dashboard now shows individual requests handled by your application, including headers and payloads, if enabled. You can filter, search, and inspect them in detail.