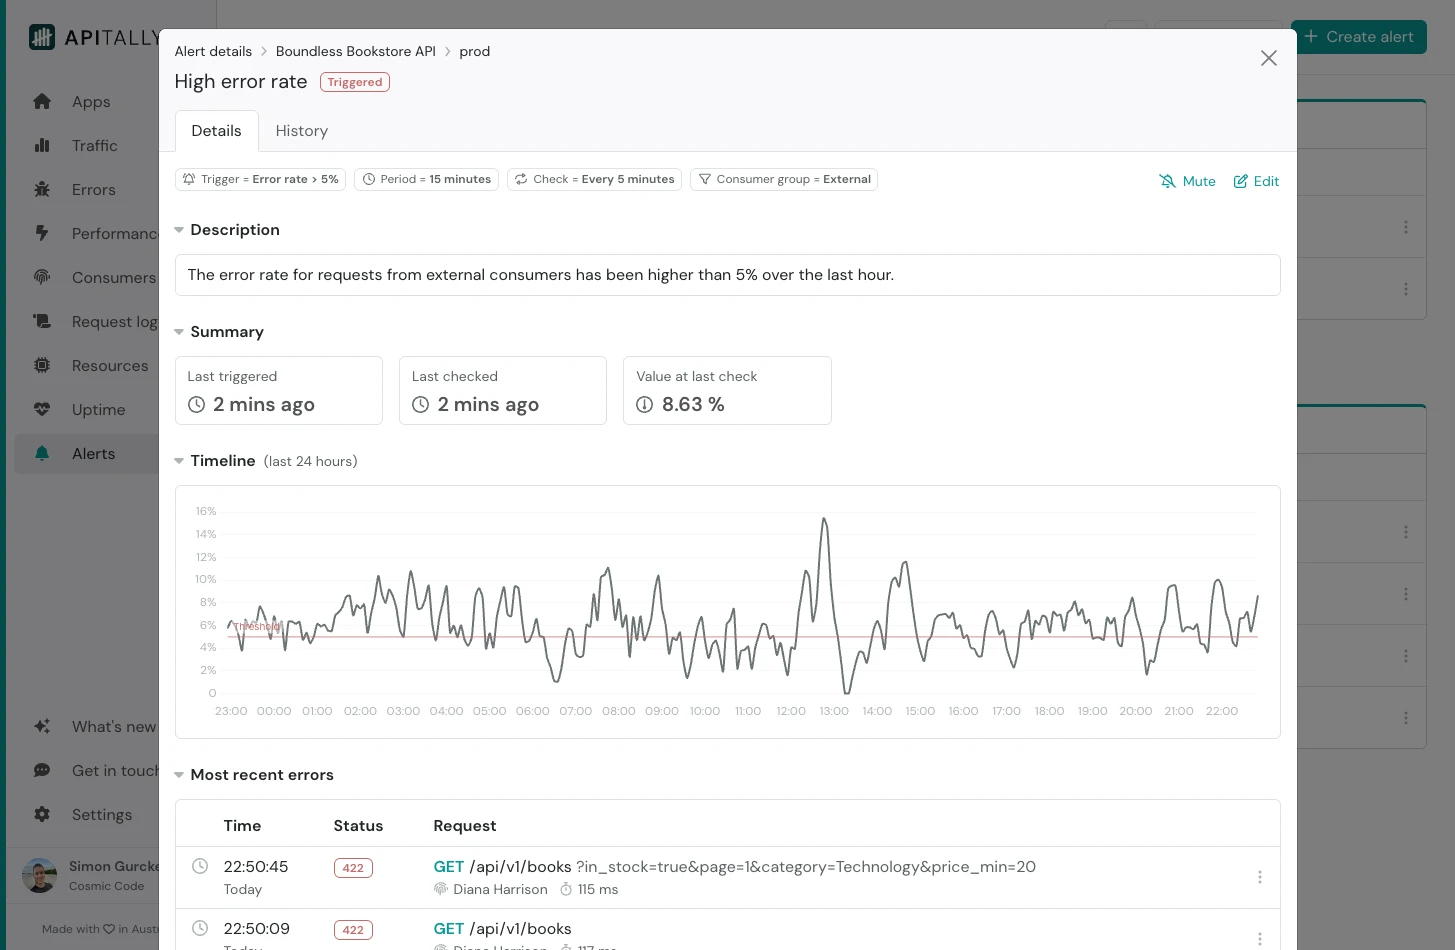
Create alerts
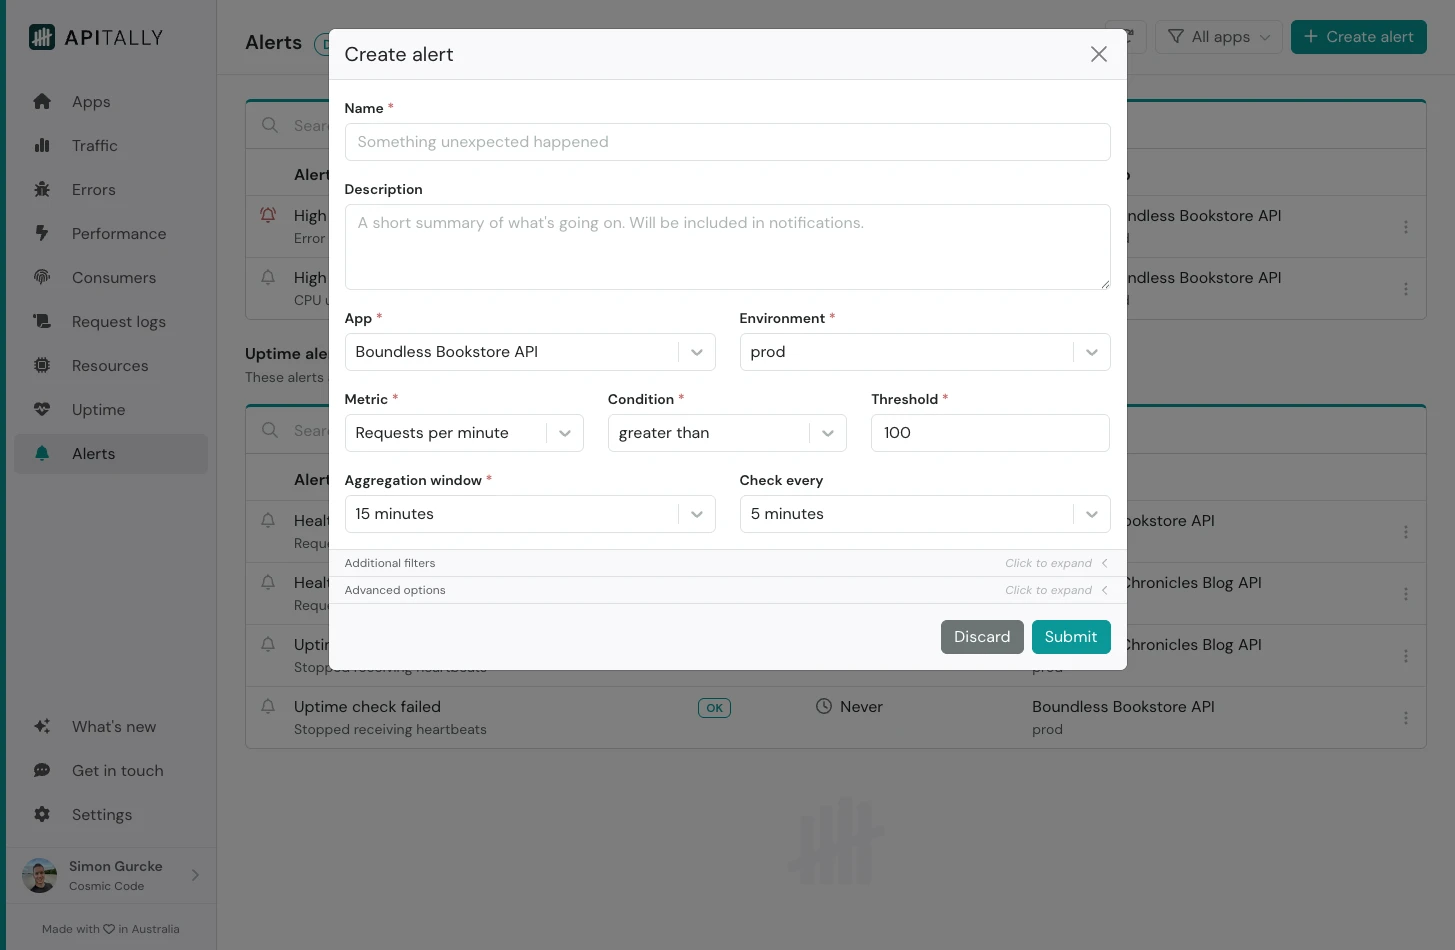
You can create a new custom alert in these simple steps:- Choose a name for your alert, and optionally add a description. Both will be shown in alert notifications to help you quickly see what’s going on.
- Select the app and the environment you want to monitor.
- Select a metric and set the threshold value and condition (e.g. “greater than 100”). See below for a list of available metrics.
- Choose an aggregation window and the frequency at which the alert condition should be evaluated.

Available metrics
- Requests per minute
- Total requests
- Data transferred (requests and responses)
- Data sent (responses)
- Data received (requests)
- Consumers (unique)
- Errors (client & server errors)
- Client errors
- Server errors
- Error rate
- Response time p50
- Response time p75
- Response time p95
- Apdex score
- CPU utilization (avg)
- CPU utilization (max)
- Memory usage (avg)
- Memory usage (max)
Filter options
You can narrow down the scope of your alerts using the following filters:- Consumer: Monitor a specific API consumer.
- Consumer group: Track metrics for a group of consumers.
- Endpoint: Alert on a specific API endpoint.
Cron schedule
While the default check frequency is set using the Check every field, you can define more complex schedules using cron expressions under the Advanced options section. The cron schedule will override the basic check frequency when specified. Examples of cron expressions:*/5 9-17 * * 1-5: Check every 5 minutes between 9 AM and 5 PM on weekdays.5 * * * *: Check 5 minutes past the hour every hour.0 9 * * *: Check every day at 9 AM.
Tune notifications
Apitally provides several options for controlling the frequency and timing of alert notifications:- Aggregation window: Define the time period over which metrics are aggregated during evaluation. Selecting a longer period can smooth out transient spikes.
- Check every / Cron schedule for checks: Set how often or when exactly to evaluate the alert conditions.
- Notify after triggered: Control how long a threshold must be breached before sending notifications.
- Notify after resolved: Specify when to send resolution notifications after conditions return to normal. This can reduce noise when conditions fluctuate around the threshold.

