

- Get detailed metrics on API usage, errors, and performance
- Track API adoption and usage by individual consumers
- Log individual API requests, responses, and correlated application logs
- See what’s causing slow API requests with traces
- Monitor uptime and set up custom alerts
Requirements
Requires Python 3.10+ and Starlette 0.29+.Create app
To get started, create a new app in the Apitally dashboard and select Starlette as your framework.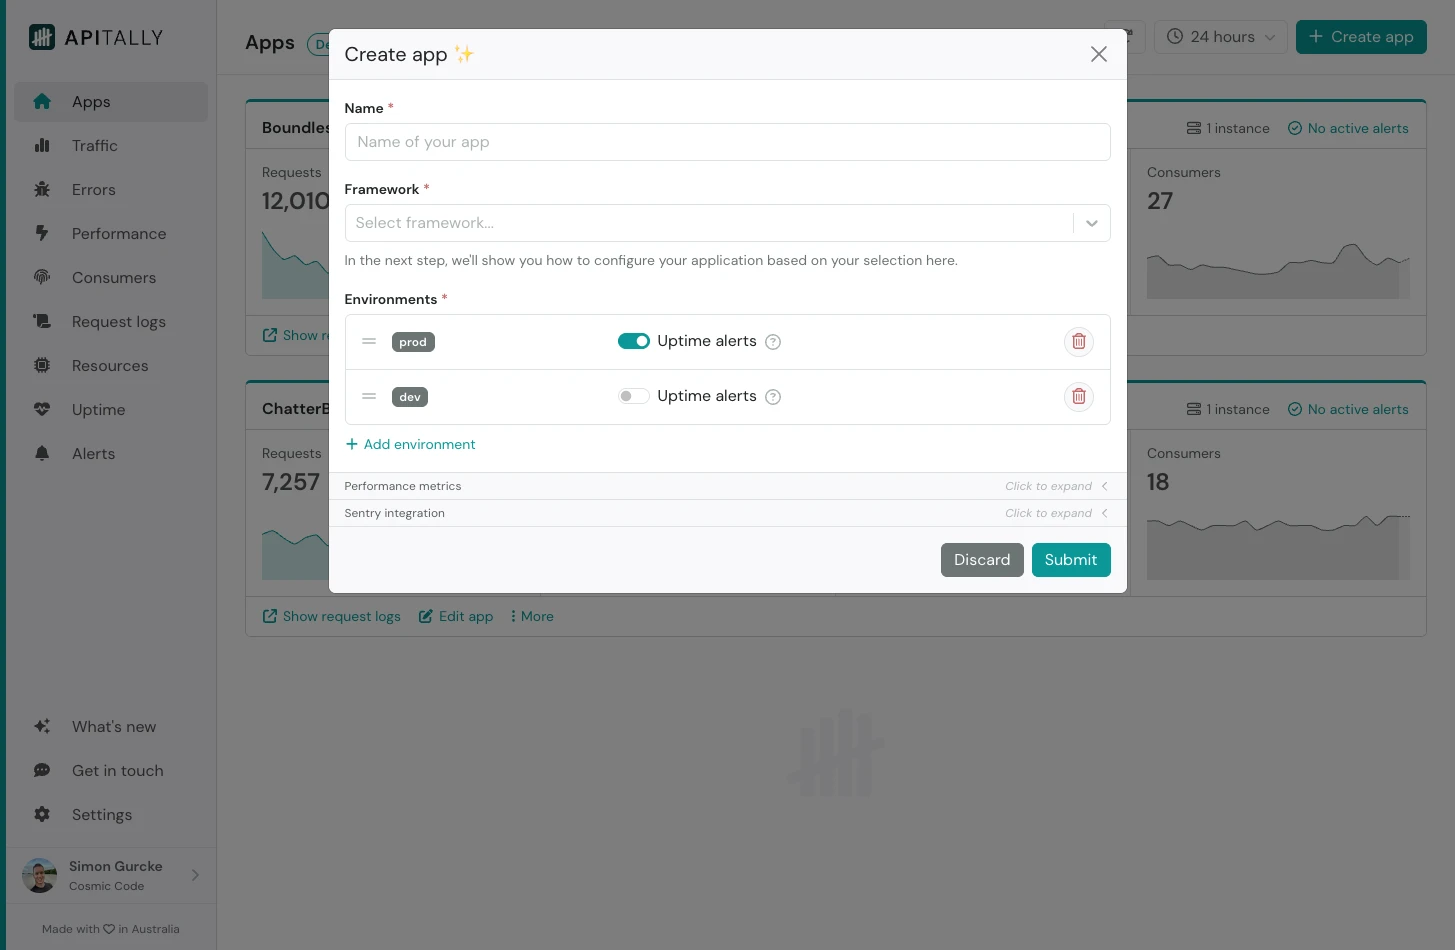 You can also configure the environments (e.g.
 prod and dev) for your app, or simply accept the defaults.
After submitting, you will see tailored setup instructions for your app. These include your write token and code snippets you can copy and paste into your project.
The write token (
apt_...) provided in the setup instructions uniquely identifies your app for the purpose of data ingestion only. It does not grant any kind of read access to your data.Install the SDK
Install the Apitally SDK with thestarlette extra as a dependency in your project.
Initialize Apitally
Callapitally.init with your Starlette application, the write token, and other configuration options immediately after creating the app.
APITALLY_WRITE_TOKEN and APITALLY_ENV environment variables instead of passing write_token and env in code.
Deploy your application with these changes, or restart it if you’re testing locally.
The basic setup is now complete. Metrics and logs will start appearing in the Apitally
dashboard.
Identify consumers
Consumers are the users or applications calling your API. Identifying them lets you analyze and filter API traffic by consumer in Apitally. Callapitally.set_consumer during request handling to associate the current request with a consumer identifier. You can call it wherever the consumer is known, such as in an endpoint, existing middleware, or authentication code.
You can also provide a display name, group, and custom attributes for each consumer.
These examples use request.user, which is provided by Starlette’s authentication middleware.
Capture headers and bodies
Only response headers are captured by default. You can opt in to capture request headers as well as request and response bodies when initializing Apitally.Mask sensitive information
The SDK automatically masks common sensitive query parameters, headers, and body fields. To mask additional data, pass regular expressions matching query parameter names, header names, or body field names tomask_query_params, mask_headers, or mask_body_fields, respectively. Matching is case-insensitive.
mask_request_body and mask_response_body callbacks to mask individual fields or entire bodies using custom logic. Use mask_log_record to mask or drop application log records.
More information about masking is available here.
Sample requests
If your application receives a lot of traffic, you may want to sample requests to stay within your request logs quota. Metrics will continue to count every request regardless of sampling. Usesample_rate to capture logs and traces for a fraction of requests.
sample_on_request and sample_on_response callbacks to make sampling decisions using custom logic.
If your application has an existing OpenTelemetry setup, your tracer provider’s sampler also affects which request logs and traces Apitally captures.
More information about sampling is available here.
Instrument third-party libraries
Instrumenting third-party libraries adds details about database queries, HTTP calls to external services, and other operations to your request traces. This lets you see how these operations contribute to API response times. The SDK provides helper functions inapitally.otel to instrument popular libraries. Each requires a separate OpenTelemetry instrumentation package. For example, to trace database queries made with SQLAlchemy, install opentelemetry-instrumentation-sqlalchemy:
instrument_sqlalchemy with your SQLAlchemy engine at application startup: