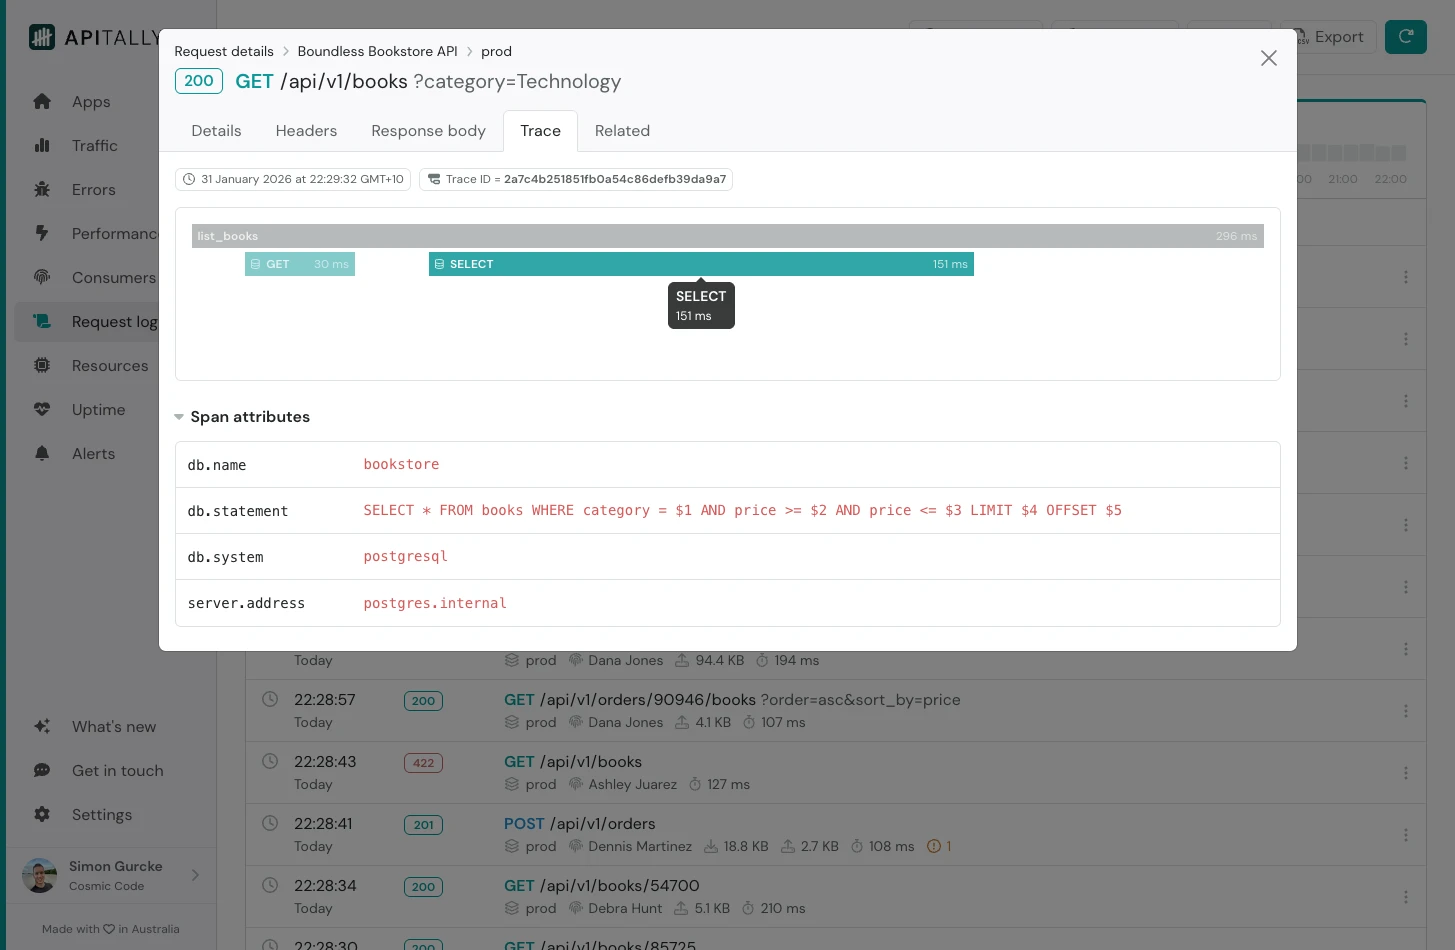
 A trace consists of one or more spans, each representing an operation such as a database query or HTTP call.
Spans are visualized as horizontal bars, with their width reflecting their duration relative to the total response time of the request.
Click on a span to view its attributes in the table below, which can include details such as the database query, the HTTP method and URL of an external request, or any custom attributes your instrumentation has added.
A trace consists of one or more spans, each representing an operation such as a database query or HTTP call.
Spans are visualized as horizontal bars, with their width reflecting their duration relative to the total response time of the request.
Click on a span to view its attributes in the table below, which can include details such as the database query, the HTTP method and URL of an external request, or any custom attributes your instrumentation has added.
API logs & traces
Traces
Get a breakdown of time spent during the handling of each request.
When a request takes longer than expected, traces help you understand exactly where the time is being spent.
Whether it’s a slow database query, an external API call, or a custom operation in your code, traces provide the visibility you need to identify and resolve bottlenecks.
If enabled, you’ll find traces in the request details in the request logs.
A trace consists of one or more spans, each representing an operation such as a database query or HTTP call.
Spans are visualized as horizontal bars, with their width reflecting their duration relative to the total response time of the request.
Click on a span to view its attributes in the table below, which can include details such as the database query, the HTTP method and URL of an external request, or any custom attributes your instrumentation has added.