 When you open the Apitally dashboard, you first land on the Apps page.
Here you see an overview of key API metrics for all your applications, including sparkline graphs that help you quickly identify unexpected spikes or drops.
Clicking on a metric or graph takes you to the relevant dashboard with more details:
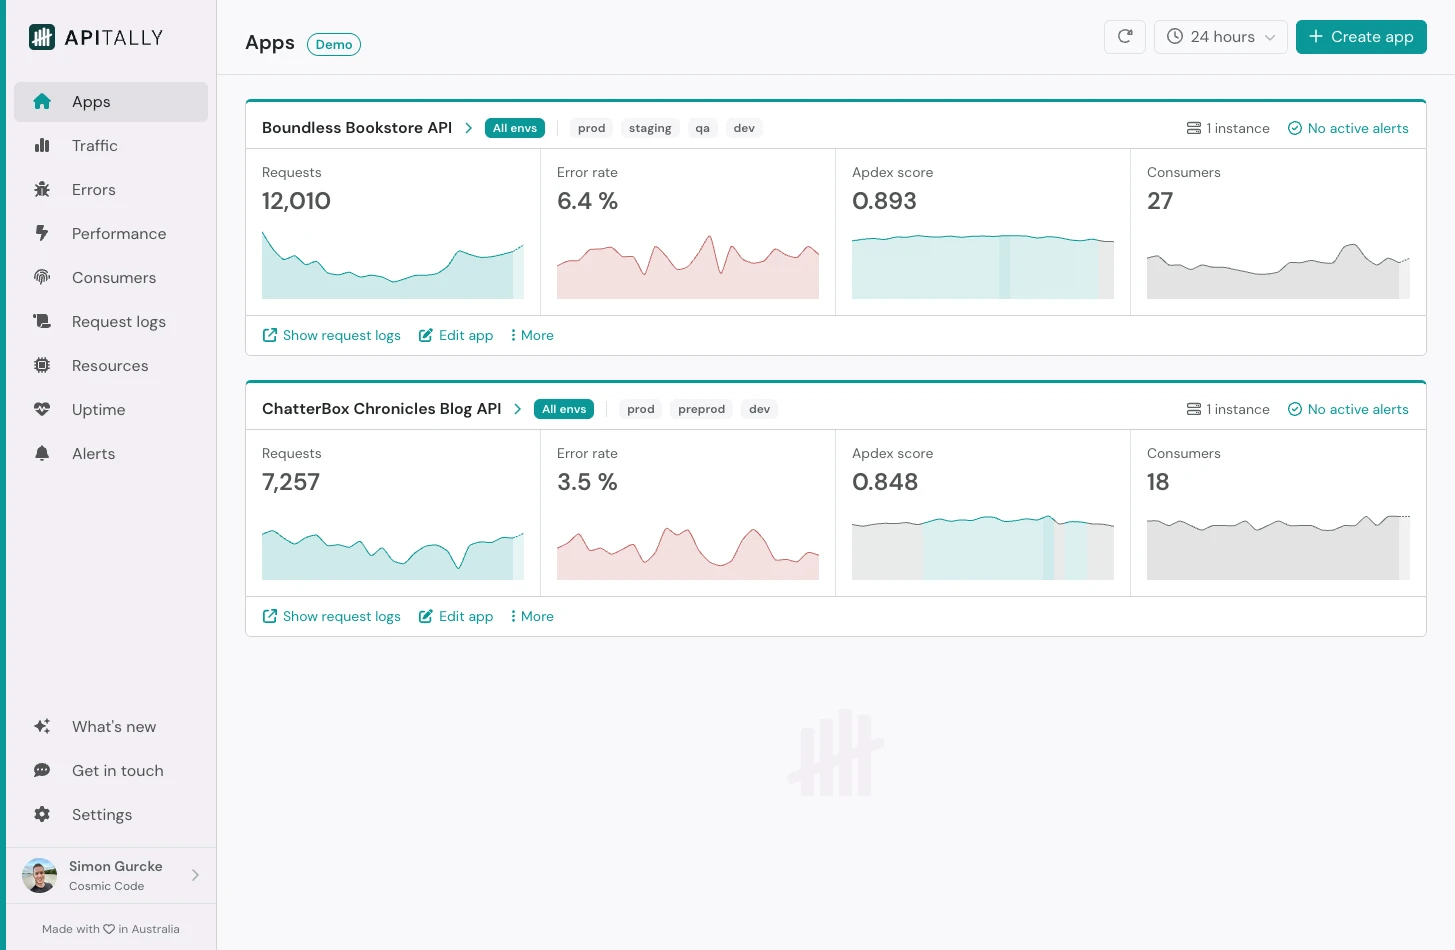
When you open the Apitally dashboard, you first land on the Apps page.
Here you see an overview of key API metrics for all your applications, including sparkline graphs that help you quickly identify unexpected spikes or drops.
Clicking on a metric or graph takes you to the relevant dashboard with more details:
Requests
Traffic dashboard
Error rate
Errors dashboard
Apdex score
Performance dashboard
Consumers
Consumers dashboard