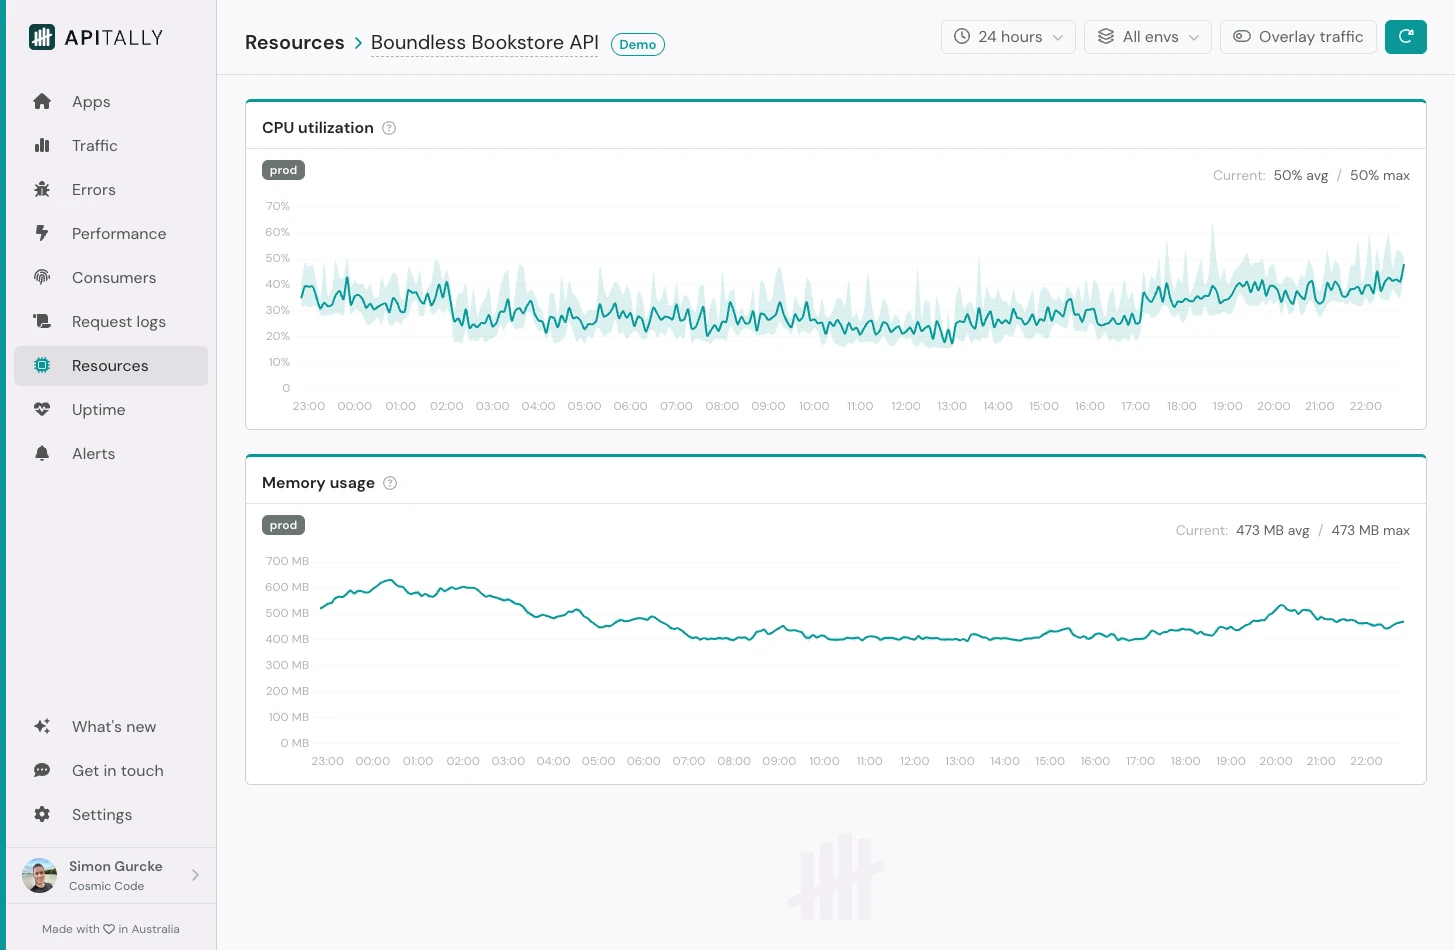
 The Resources dashboard displays your application’s CPU and memory usage over time.
This data is collected automatically by the Apitally SDK and aggregated across all running instances within each environment.
Each chart displays the average value as a line and the range between minimum and maximum values as a shaded area.
The current average and maximum values are shown in the top-right corner of each chart.
The Resources dashboard displays your application’s CPU and memory usage over time.
This data is collected automatically by the Apitally SDK and aggregated across all running instances within each environment.
Each chart displays the average value as a line and the range between minimum and maximum values as a shaded area.
The current average and maximum values are shown in the top-right corner of each chart.
API metrics
Resources dashboard
Monitor CPU and memory usage, correlate it with API traffic.
The Resources dashboard displays your application’s CPU and memory usage over time.
This data is collected automatically by the Apitally SDK and aggregated across all running instances within each environment.
Each chart displays the average value as a line and the range between minimum and maximum values as a shaded area.
The current average and maximum values are shown in the top-right corner of each chart.