Requests
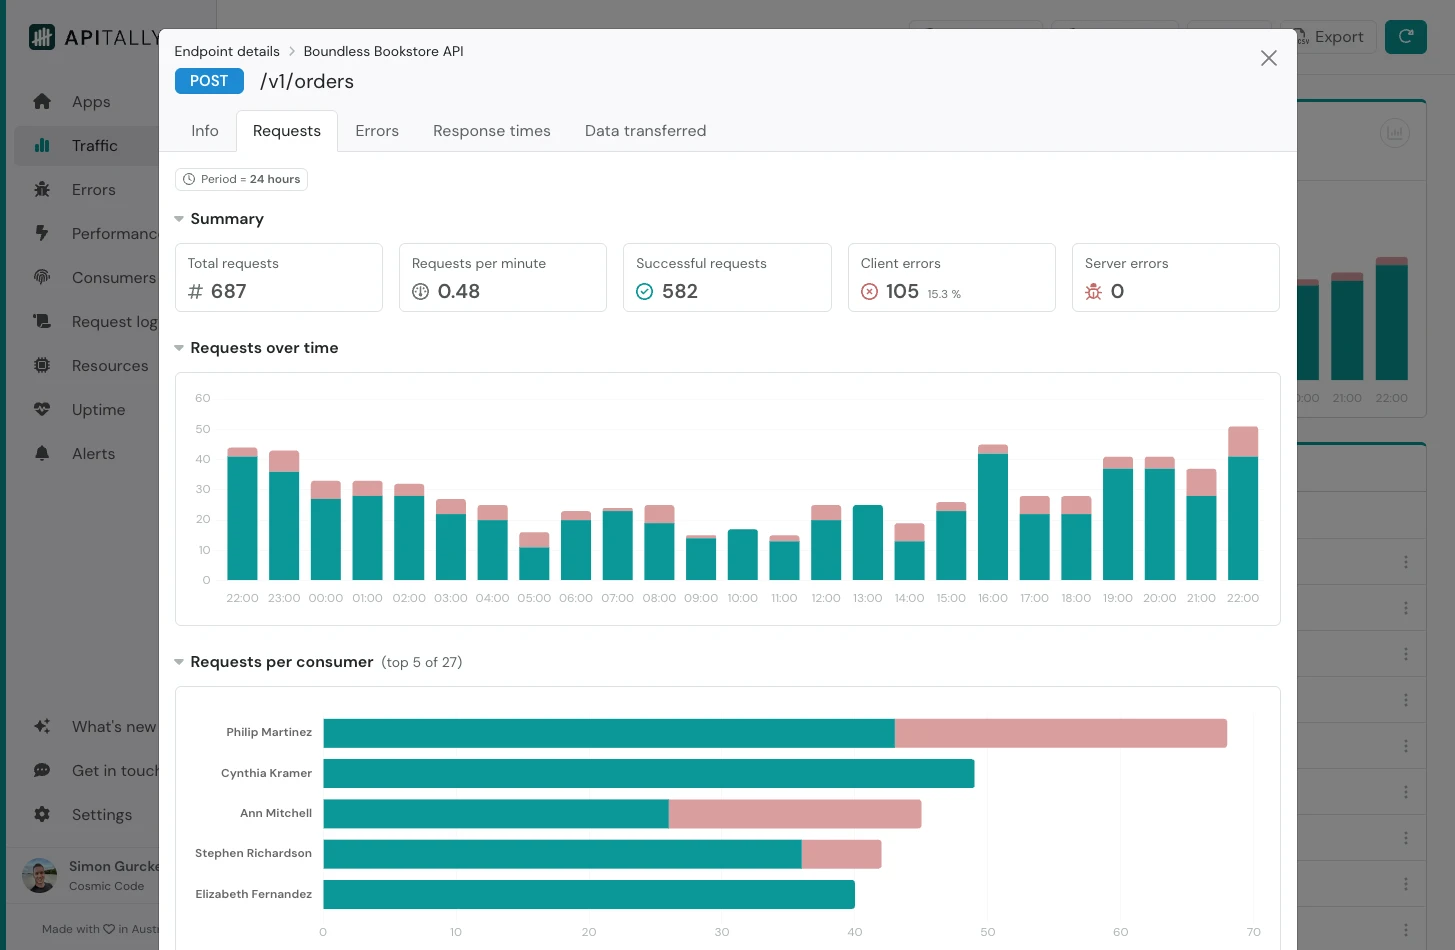 The Requests tab provides different breakdowns of the requests made to the API endpoint. At the top you see a summary with the following metrics:
- Total requests
- Requests per minute
- Successful requests
- Client errors
- Server errors
Errors
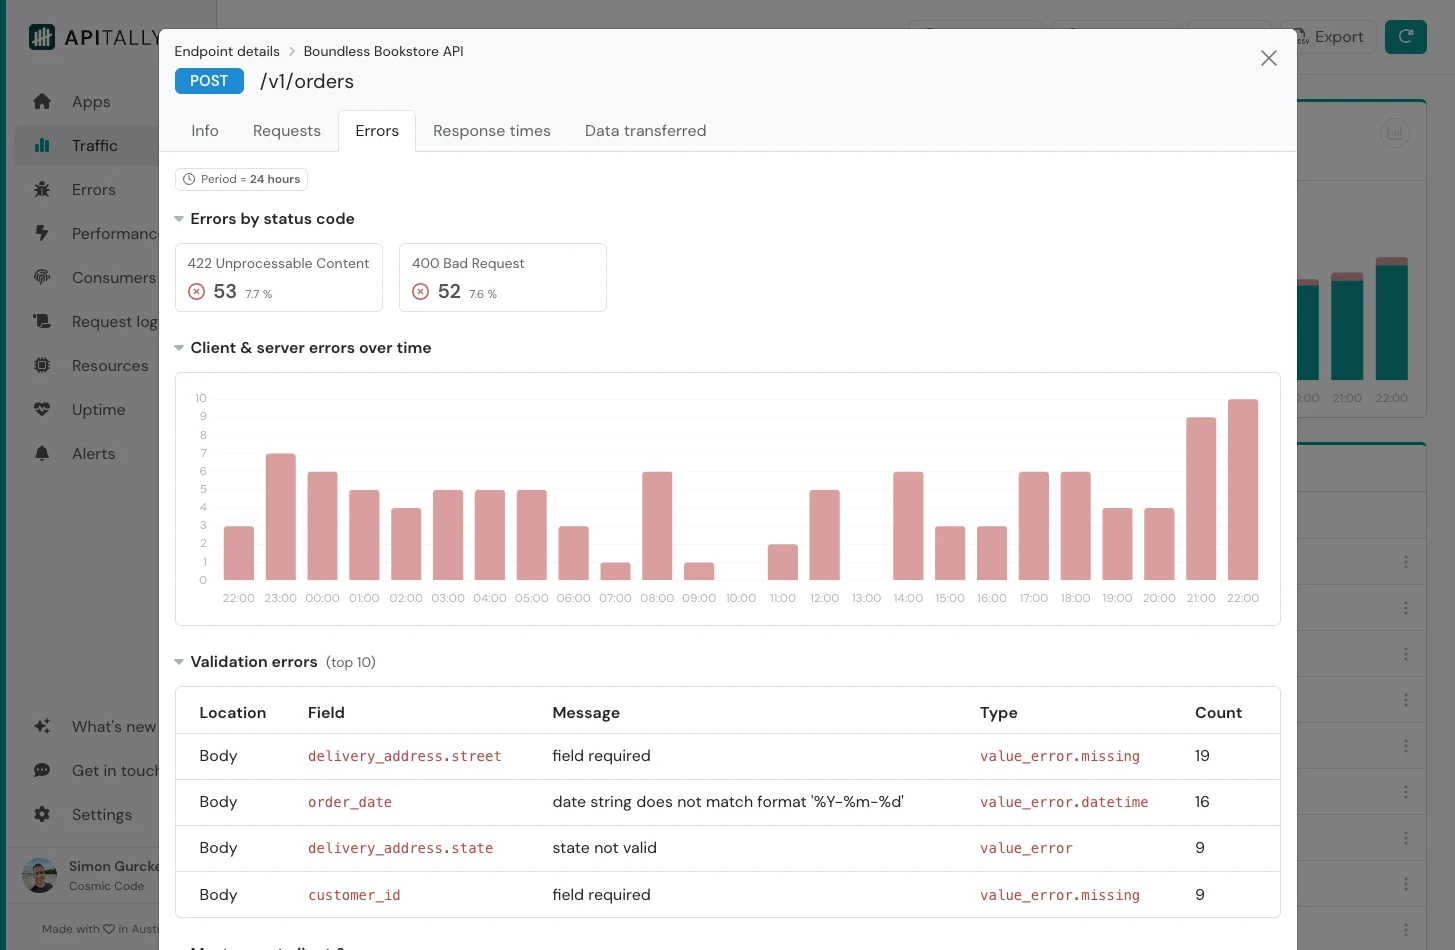 The Errors tab provides details about failed requests to your API endpoint.
Requests are considered unsuccessful if the response status code is in the 4xx or 5xx range, and the specific status code has not been marked as expected.
At the top you see a breakdown of unsuccessful status codes returned by the endpoint, along with the number of occurrences and the percentage of all requests.
You can click on the status codes to navigate to the errors dashboard, which provides more details about that specific error.
An area chart shows a trend of client and server error rates over time.
The error rates are calculated as the number of failed requests divided by the total number of requests.
If the endpoint returned validation errors to consumers, the table below provides details about those errors.
That includes the fields that failed validation, the error messages, and the number of occurrences.
If there were any server errors, another table provides details about the exception type and message, the number of occurrences and a stacktrace.
The Errors tab provides details about failed requests to your API endpoint.
Requests are considered unsuccessful if the response status code is in the 4xx or 5xx range, and the specific status code has not been marked as expected.
At the top you see a breakdown of unsuccessful status codes returned by the endpoint, along with the number of occurrences and the percentage of all requests.
You can click on the status codes to navigate to the errors dashboard, which provides more details about that specific error.
An area chart shows a trend of client and server error rates over time.
The error rates are calculated as the number of failed requests divided by the total number of requests.
If the endpoint returned validation errors to consumers, the table below provides details about those errors.
That includes the fields that failed validation, the error messages, and the number of occurrences.
If there were any server errors, another table provides details about the exception type and message, the number of occurrences and a stacktrace.
Response times
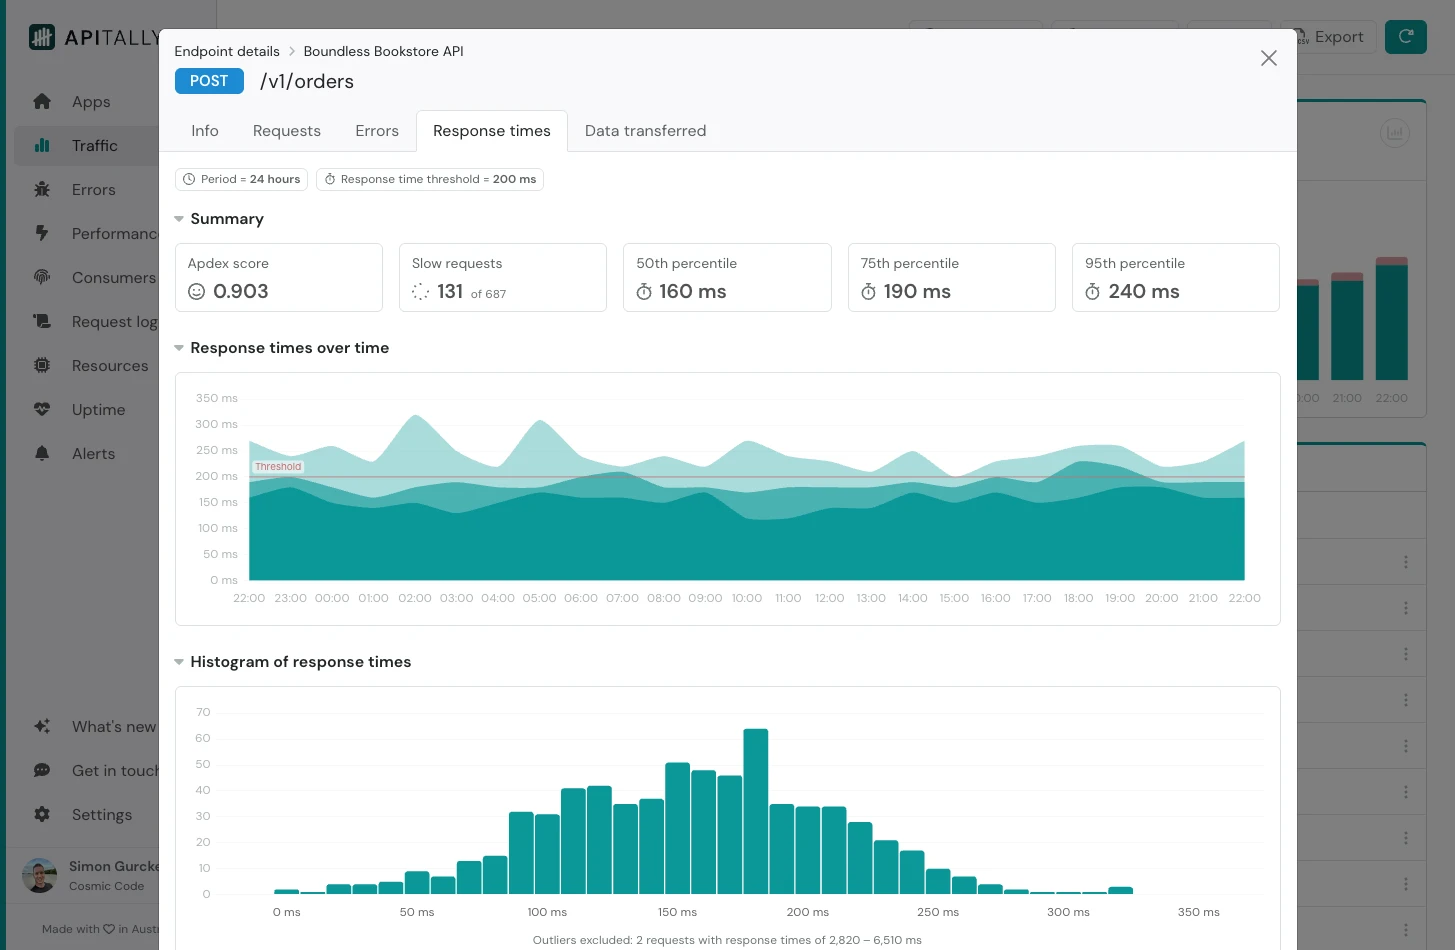 The Response times tab provides insights into the performance of the API endpoint, measured by the time it takes to respond to requests.
In the summary at the top you see the 50th, 75th and 95th percentile of response times.
The area chart below shows how these percentiles have been trending over time.
Additionally you see a histogram of response times, providing a full picture of the distribution of response times for the endpoint, including any outliers.
The Response times tab provides insights into the performance of the API endpoint, measured by the time it takes to respond to requests.
In the summary at the top you see the 50th, 75th and 95th percentile of response times.
The area chart below shows how these percentiles have been trending over time.
Additionally you see a histogram of response times, providing a full picture of the distribution of response times for the endpoint, including any outliers.
Data transferred
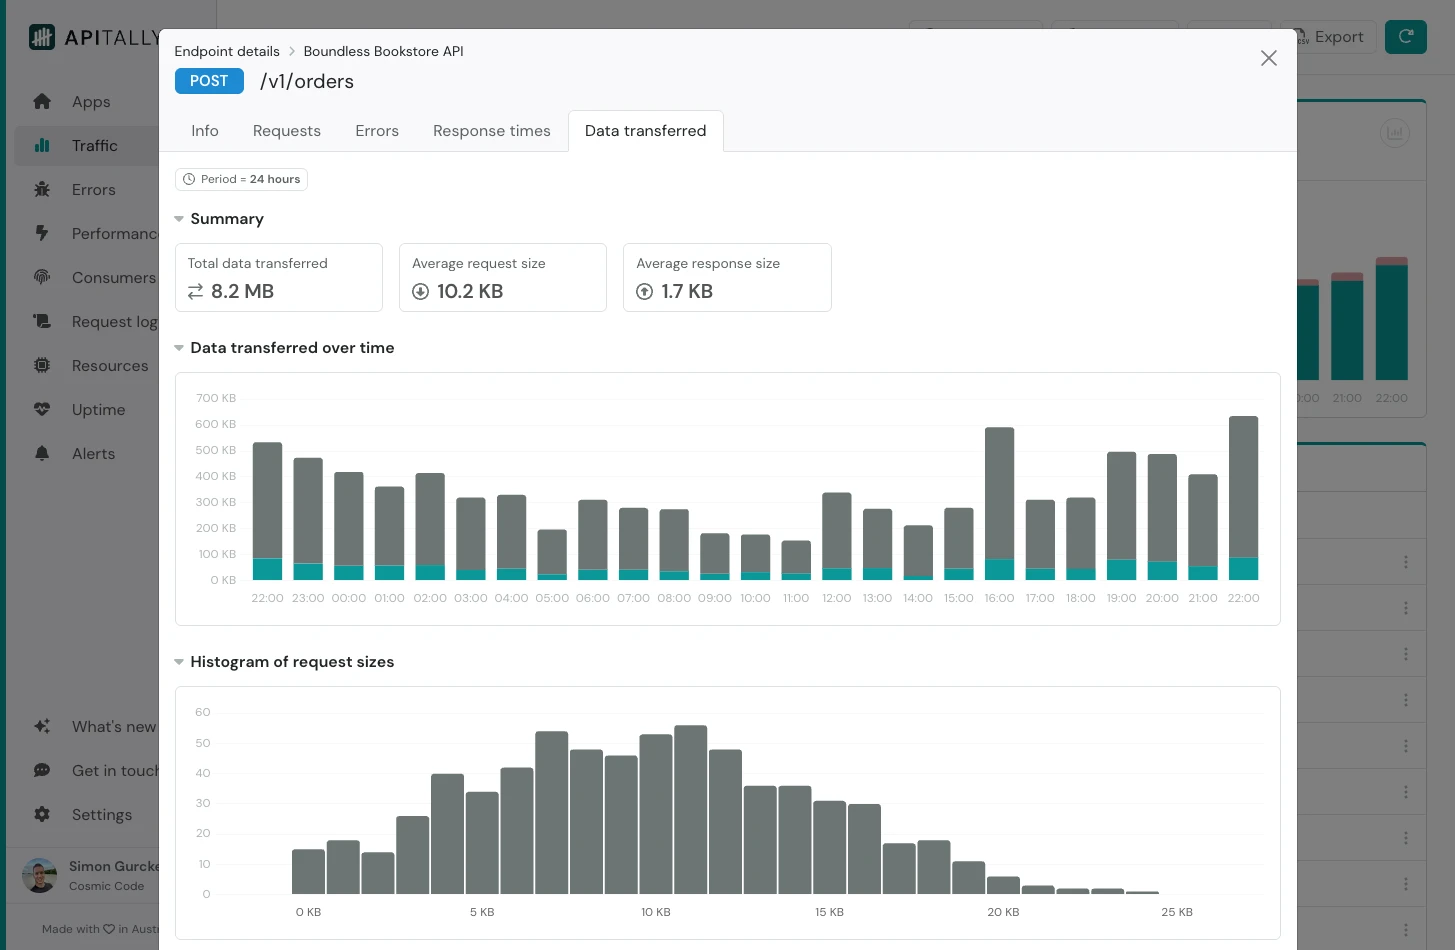 The Data transferred tab provides insights into the size of payloads received and sent by the API endpoint.
These are based on the
The Data transferred tab provides insights into the size of payloads received and sent by the API endpoint.
These are based on the Content-Length headers in the requests and responses.
The summary at the top includes the total amount of data transferred in the selected period as well as the average sizes of requests and responses.
The bar chart below shows the distribution of data transferred over time, broken down by incoming (requests) and outgoing (responses).
There are also histograms of the request and response sizes, so you can get a full picture of their distribution, including any outliers.