Documentation Index
Fetch the complete documentation index at: https://docs.apitally.io/llms.txt
Use this file to discover all available pages before exploring further.
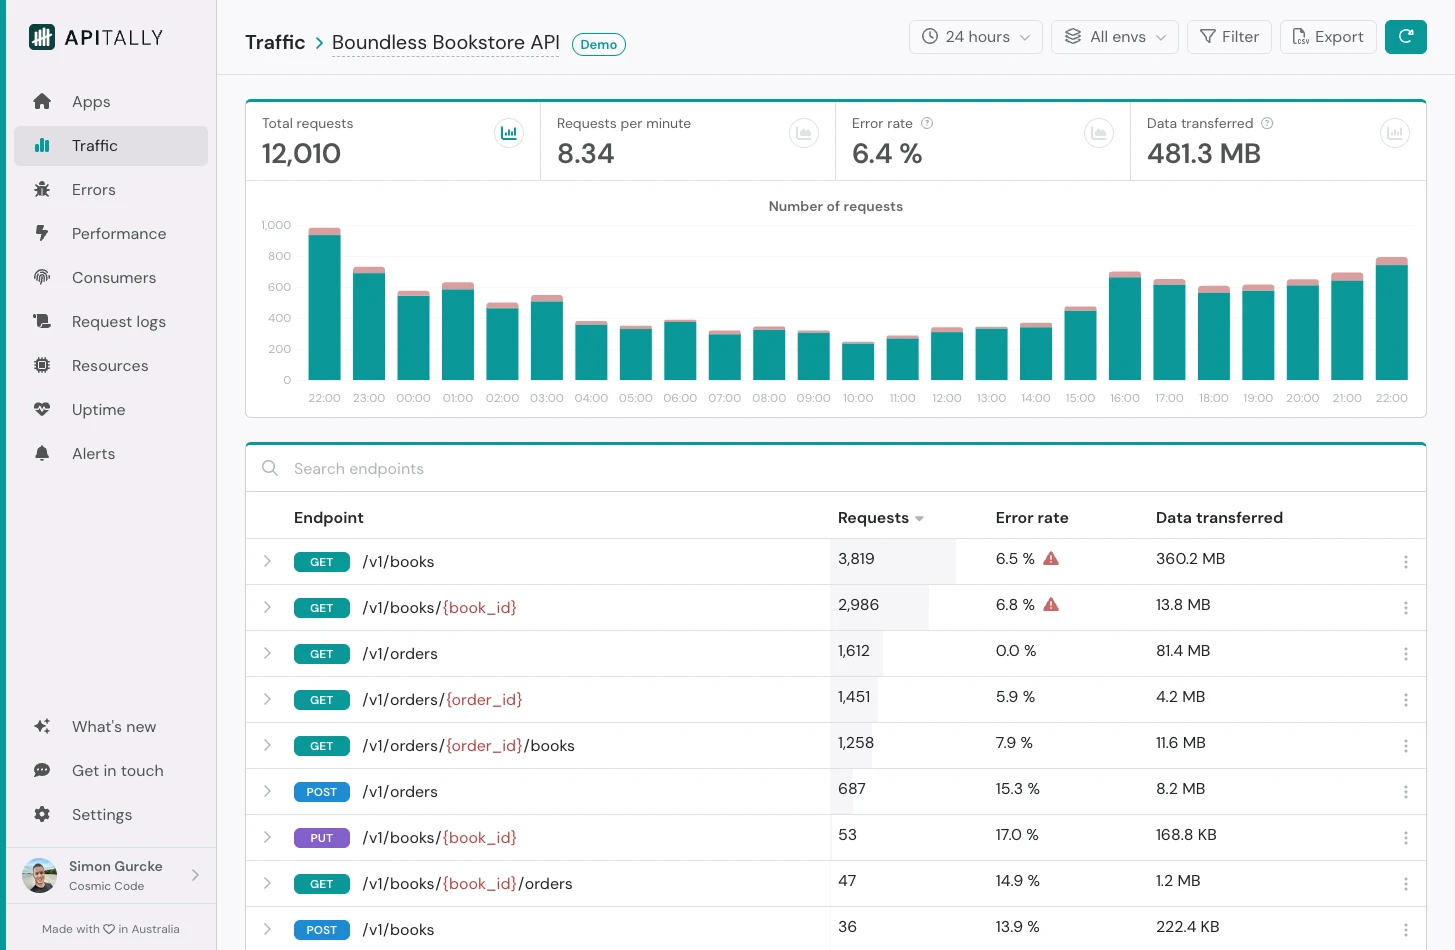 The Traffic dashboard provides insights into the overall traffic to your API as well as usage of each API endpoint.
Traffic metrics
The top section of the dashboard focuses on the following API metrics:- Total requests (broken down by response status code on hover)
- Requests per minute (RPM)
- Error rate
- Data transferred (received and sent)
Endpoints table
The table lists all endpoints of your API along with their traffic metrics. The Apitally SDKs use introspection to discover all endpoints defined in your application, even if they haven’t been called yet. By default, the table is ordered by request count, with the most used endpoint at the top. It can be searched and sorted by any of the other metrics too. Clicking on an endpoint in this table opens a modal with detailed endpoint insights.Filters
The dashboard includes a range of filtering options. These are persistent and will remain active when you navigate to another dashboard.Time period
You can view data for a specific time period using several methods:- Select a standard period (e.g. 24 hours or 30 days) from the dropdown menu.
- Click and drag across the chart to select a custom range.
- Click a single bar on the chart to focus on that interval.
- Choose Custom from the dropdown to manually enter a start and end date.
Environment
By default, the dashboard displays metrics from all environments. To view data for a specific environment, select it from the environment filter dropdown.Filter pane
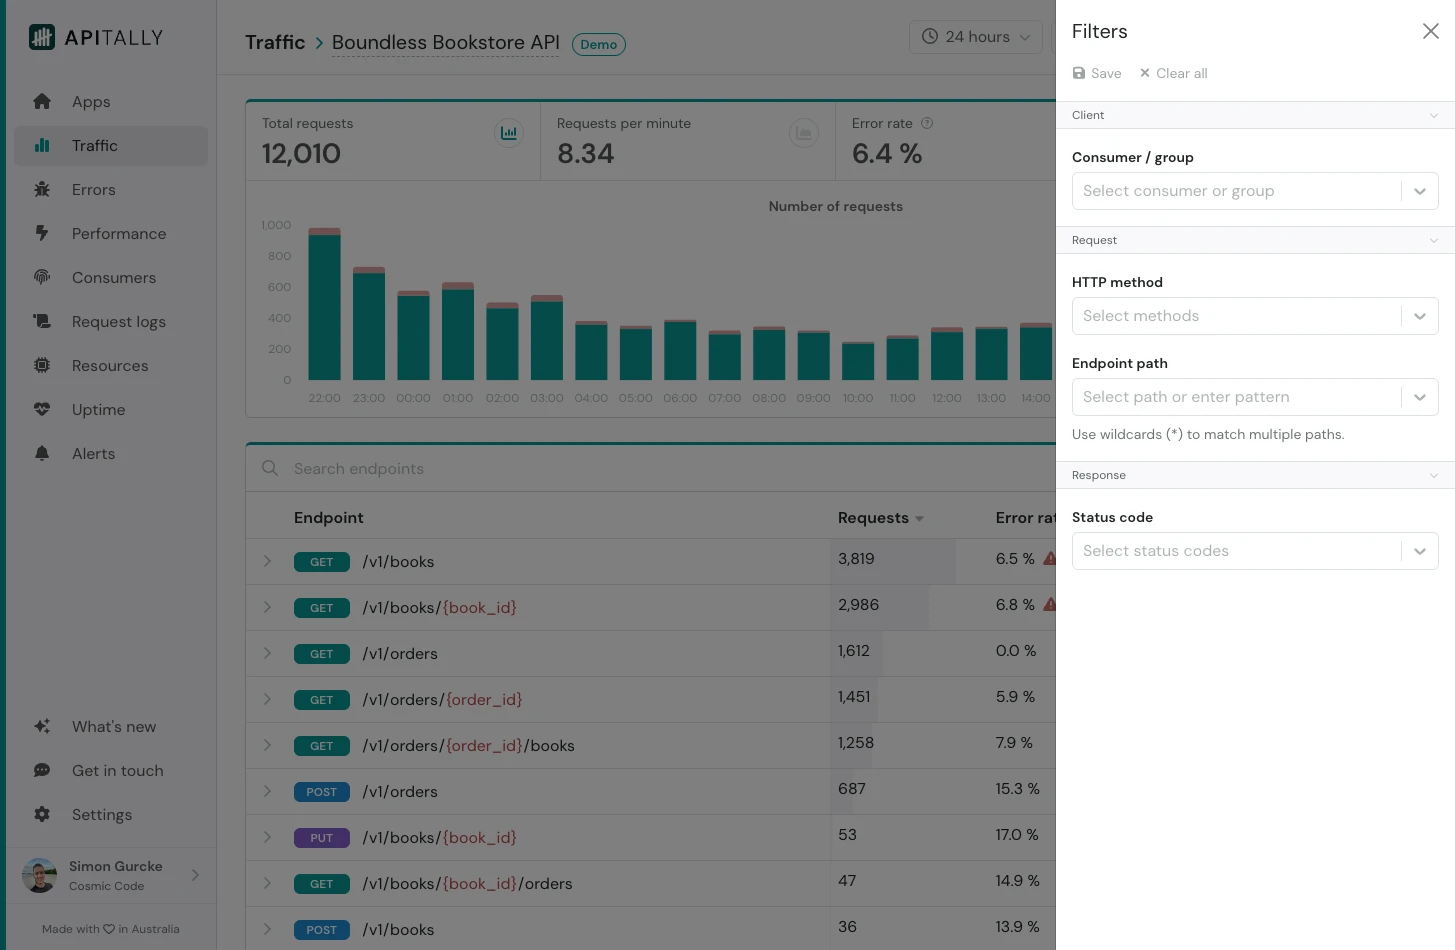 Clicking the Filter button opens a side pane with additional filtering options:
- API consumer or consumer group
- HTTP method (e.g.
GET,POST) - Endpoint path (supports wildcards)
- Response status code (e.g.
200,4xx)
Save filters
You can save filters to quickly switch between different views. Saved filters can be shared with other team members.Exclude endpoints
Traffic from automated services, such as health checks, can skew your metrics and hide important insights. You can exclude affected endpoints (e.g./health) from metrics by opening the Endpoint settings from the dropdown menu in the endpoints table and enabling the Exclude requests toggle.